What this does
The Profitability Report shows your company's financial performance — Buy, Sell, Margin, Commission, and Net Margin — grouped by the business dimension you choose (month, customer, tariff, vendor, sales rep, carrier rep, or shipment-level detail). On the Sales Rep and Carrier Rep reports you can also choose whether to include shipments whose only commission is $0.00, and you can export any view to Excel.
- Seven report views, from high-level monthly trends down to shipment-level detail.
- Consistent metrics across every view: Shipments, Buy, Sell, Gross Margin, Margin %, Commission, Net Margin.
- A Show $0.00 Commissions option on the Sales Rep and Carrier Rep reports so $0.00 commissions used to track work handled outside the TMS are not silently dropped.
- Export to Excel for any report type.
User Guide
How to open the Profitability Report
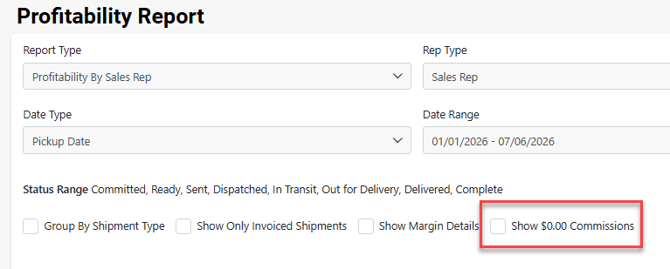
Where to go: Reports tab → select Profitability Report from the list.
- Choose a Report Type, set your filters, then select Create Report.
Report types
There are seven report types:
- Profitability by Month — financial totals grouped by year and month, with a trend chart; the default view.
- Profitability by Organization (Customer) — totals grouped by customer/organization.
- Profitability by Tariff — totals grouped by tariff.
- Profitability by Vendor — totals grouped by vendor (organization or carrier).
- Profitability by Sales Rep — totals grouped by the commission sales rep.
- Profitability by Carrier Rep — totals grouped by the carrier rep.
- Profitability by Detail — a shipment-by-shipment breakdown with accounting and routing columns.
The Sales Rep and Carrier Rep reports include a Rep Type dropdown so you can generate the report for Sales Rep, Carrier Rep, or both.
Default view and filters
Where to go: Reports → Profitability Report.
- By default the report opens on Profitability by Month, filtered by Pickup Date, covering the first day of the current year through today, for shipments in statuses Quote through Complete.
- Date Type — choose Entry, Pickup, Delivery, or Invoice date as the basis for the date range.
- Date Range — the start and end dates the report covers.
- Min/Max Shipment Status — limit results to a status range (e.g., Committed through Complete).
- Show Only Invoiced Shipments — limits results to invoiced shipments.
- Group By Shipment Type (Organization, Vendor, Sales Rep, Carrier Rep) — breaks each grouping out by shipment type.
- Show Margin Details — adds service/processing/marketplace fee margin columns (Detail report and business-level users).
How commissions are counted
The Profitability Report counts only commissions in an approved billing status. Commissions marked "No Accounting" — the status the system uses for declined commissions — are excluded from the Commission column and Net Margin. The system also automatically marks every $0.00 commission as "No Accounting," so $0.00 commissions are excluded by default even though they weren't formally declined.
- This is why the Sales Rep and Carrier Rep reports offer the Show $0.00 Commissions option (below) — to bring those $0.00 commissions back in when you want them.
- Non-zero declined commissions stay excluded; there is no option to include those.
What a $0.00 commission is and why you have them
A $0.00 commission is a commission record on a shipment with an amount of zero. Both carrier reps and sales reps can have them, and they usually come from how commissions are configured:
- Carrier reps — from the LSP staff profile. If your organization has the Add Carrier Rep Commissions checkbox enabled (My Organization → Edit Settings), Tai automatically records the user who assigns the carrier as the Carrier Rep, using that person's commission type and amount from their LSP staff profile. A new staff profile defaults to Flat $0.00, so unless that default was changed the carrier rep commission is $0.00.
- Sales reps — from the customer profile. Sales rep commissions come from the commission setup on a customer's profile. If a sales rep is listed on the customer profile, each time a shipment is created for that customer the rep is set as the Sales Rep and a commission record is created automatically. That record can be configured as an actual amount or as $0.00 — for example, when the commission is calculated outside the TMS.
- Entered manually. A $0.00 commission can also be added by hand to credit a rep for a load whose commission is handled outside the TMS.
Whenever a commission is configured with an actual amount instead of $0.00 — a non-zero LSP staff profile default for a carrier rep, or a non-zero commission on the customer profile for a sales rep — the resulting commission is not $0.00, so it is counted in the report normally and does not need the Show $0.00 Commissions option.
Because Tai automatically marks every $0.00 commission as "No Accounting," the reps tied to them are left out of the Sales Rep and Carrier Rep reports by default — which is exactly what the Show $0.00 Commissions option turns back on.
Carrier Rep example. Morgan's LSP staff profile still has the default commission of Flat $0.00. Morgan books a load and assigns the carrier. Because Add Carrier Rep Commissions is enabled for the organization, Tai adds Morgan as the Carrier Rep and calculates the commission from that default — $0.00 — and marks it "No Accounting." On the Profitability by Carrier Rep report, Morgan's load is hidden by default; check Show $0.00 Commissions and it appears under Morgan. If Morgan's profile default were set to a real amount, the commission would be that amount and would show without the checkbox.
Sales Rep example. Alex is listed as the Sales Rep on a customer's profile with a commission of $0.00 because their commission on that account is handled outside the TMS. Each time a shipment is created for that customer, Tai creates a $0.00 sales rep commission for Alex and marks it "No Accounting." On the Profitability by Sales Rep report, those loads are hidden by default; check Show $0.00 Commissions to include them. If the customer profile listed a real commission amount for Alex, it would appear without the checkbox.
How to include $0.00 commissions (Sales Rep & Carrier Rep)
Where to go: Reports → Profitability Report → set Report Type to Profitability by Sales Rep or Profitability by Carrier Rep.
- A Show $0.00 Commissions checkbox appears with these two report types. It is unchecked by default.
- Unchecked: shipments whose only commission is $0.00 are excluded, along with any other non-approved commissions — this is the standard behavior.
- Checked: all $0.00 commissions are included, even ones the system marked as not going to accounting. Use this when your team enters $0.00 commissions to track loads handled outside the TMS.
- Non-zero declined commissions stay excluded whether the box is checked or not — this option only affects $0.00 commissions.
- Because $0.00 has no dollar value, checking the box changes which shipments/reps are counted, not the total commission dollars.
The Show $0.00 Commissions checkbox appears only on the Sales Rep and Carrier Rep reports.
Understanding how reps are counted (Sales Rep & Carrier Rep reports)
Where to go: Reports → Profitability Report → Profitability by Sales Rep or Carrier Rep.
Reps are counted from the shipment's commissions and its saved Carrier Rep assignment, not from who created the load:
- Carrier Rep only: if a user is the Carrier Rep on the shipment and there is exactly one commission, they are counted only as the Carrier Rep.
- Sales Rep from the commission: if the load creator is not the commission sales rep, the person actually assigned to the commission is counted as the Sales Rep.
- Both roles: if the same user is the Carrier Rep and also holds two commissions on the shipment, they are counted as both Carrier Rep and Sales Rep.
Example: Jordan creates a load for a customer but the commission is assigned to Alex. Morgan is saved as the Carrier Rep. On the Sales Rep report, Alex is counted as the Sales Rep (not Jordan); on the Carrier Rep report, Morgan is counted.
Note: the report only reflects the Carrier Rep for loads where that user assigned the carrier and saved the shipment. Editing the Carrier Rep reference field by hand does not change the report.
Profitability Detail columns
The Detail report gives a shipment-level breakdown and supports filtering by Customer and Vendor Type (Organization / Carrier).
- Shipment ID
- Office
- Customer
- Customer Type
- Linehaul Carrier
- Sales Reps
- Buy
- Sell
- Margin
- Commission
- Net Margin
- Origin City
- Origin State
- Destination City
- Destination State
- Status
- Entry Date
- Pickup Date – Uses the Pickup Ready Date / Time value of the shipment.
- Delivery Date – Uses the Estimated Delivery Date / Time value of the shipment.
- Invoice Date
- Invoice Payment Status
- Bill Date
- Bill Payment Status
- Linehaul Carrier Pro Number
- Tariff Name
- Organization Hierarchy
Metrics shown in every view
- Shipments — total loads in the data set.
- Buy — cost paid to the carrier.
- Sell — amount billed to the customer.
- Gross Margin — total profit before commissions, calculated as:
Gross Margin = Sell - Buy
- Margin % — gross margin as a percentage of sell.
- Commission — total commissions on the loads.
- Net Margin — profit after subtracting commissions, calculated as:
Net Margin = Gross Margin - Commission
- Net Margin % — net margin as a percentage of sell.
How to export to Excel
Where to go: Reports → Profitability Report → set your report type and filters.
- Select Export to Excel to download the current report as an
.xlsxfile. - The export uses the same filters as the on-screen report, including Show $0.00 Commissions on the Sales Rep and Carrier Rep reports.
- Export to Excel requires export permission; if you don't see the button, contact your administrator.
Permissions required
- Business-level access: Reports - Business Level; User Allowed Org Access.
- Organization-level access with accounting visibility: User Allowed Org Access; Accounting AR Payments; Reports - Basic.
Tips & best practices
- If your team enters $0.00 commissions to track work done outside the TMS, run the Sales Rep or Carrier Rep report with Show $0.00 Commissions checked so those loads are counted.
- Leave the box unchecked for a clean view of paid/approved commission activity.
- Use Group By Shipment Type to see how a rep or customer performs across truckload vs. LTL vs. other modes.
Frequently asked questions
Why don't I see the "Show $0.00 Commissions" checkbox?
It only appears on the Profitability by Sales Rep and Profitability by Carrier Rep report types. It is intentionally hidden on the Month, Organization, Tariff, Vendor, and Detail reports because it has no effect there. If you don't see it on Sales Rep or Carrier Rep, the option may not be enabled for your account yet — contact support.
Does checking the box change my commission totals?
No. $0.00 commissions add no dollars, so the commission and net margin dollar totals stay the same. What changes is which shipments/reps are included in the report.
Where do $0.00 commissions come from?
They come from how commissions are configured. Carrier rep commissions are added automatically when Add Carrier Rep Commissions is enabled (My Organization → Edit Settings), using the rep's default commission from their LSP staff profile — which defaults to Flat $0.00 on a new profile. Sales rep commissions come from the commission set up on the customer's profile: if a rep is listed there, a commission record is created automatically on each shipment for that customer, and it can be an actual amount or $0.00. Either type can also be entered manually. When a commission is $0.00 it is excluded by default, and the Show $0.00 Commissions option brings it back.
Why is my carrier rep's commission showing as $0.00?
The auto-added carrier rep commission uses the rep's default commission type and amount from their LSP staff profile. New staff profiles default to Flat $0.00, so if that was never updated the commission is zero. To stop future carrier rep commissions from being zero, update the staff member's default commission in their LSP staff profile to an actual amount.
Why is my sales rep's commission showing as $0.00?
Sales rep commissions are created from the commission set up on the customer's profile. If the rep is listed on the customer profile with a $0.00 commission (often because it's calculated outside the TMS), each shipment for that customer creates a $0.00 sales rep commission. To change it going forward, update the commission on the customer profile to an actual amount.
Are declined commissions included when I check the box?
No. Only $0.00 commissions are added. Non-zero declined commissions remain excluded whether the box is checked or not.
Why does the Profitability Detail report show $0.00 commission shipments?
The Detail report always includes $0.00 commission shipments and does not offer the checkbox, so you always see the full shipment-level picture.
Why doesn't my report match who created the load?
Reps are counted from the shipment's commissions and its saved Carrier Rep assignment, not from who created the load. See "Understanding how reps are counted" above.
Does the Excel export respect my filters?
Yes. Export to Excel uses the same filters as the on-screen report, including Show $0.00 Commissions on the Sales Rep and Carrier Rep reports.
If something doesn't work
- Checkbox missing on the Sales Rep/Carrier Rep report: confirm the report type is set correctly; if it's still missing, the option may not be enabled for your account — contact support.
- A shipment you expected isn't in the Sales Rep/Carrier Rep report: check whether its only commission is $0.00 and re-run with Show $0.00 Commissions checked, and confirm the date range and Min/Max Shipment Status include it.
- Export to Excel button missing: you may not have export permission — contact your administrator.
- Numbers look off: verify the Date Type and Date Range, then contact support with the report type and filters used.
To learn more, see Introduction to Reports, Billing Variance Report, and the Commissions articles.