It provides visibility into performance across three operational roles:
-
Created By
-
Carrier Rep
-
Sales Rep
The report supports time-based trends and filtering so teams can track:
-
shipment volume,
-
revenue and margin,
-
and performance over time.
Who Should Use This Report?
This report is commonly used by:
-
LSP owners
-
Operations managers
-
Sales managers
-
Carrier reps / sales reps (to track their own performance)
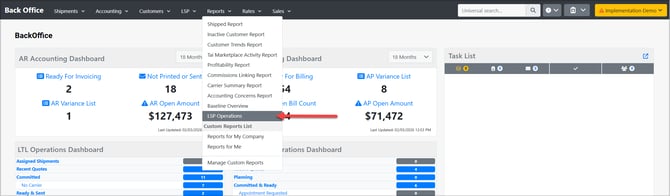
How to Access the Report
From the Reports tab, select LSP Operations.
How to Run the Operator Performance Report
1) Select Report Type
The Report Type determines which staff role the report is grouped by:
-
Created By (default)
-
Carrier Rep
-
Sales Rep
2) Choose Trend Type
The Trend setting controls how results are grouped over time:
-
Daily
-
Weekly
-
Monthly
-
Yearly
This allows you to compare performance across time periods and identify changes in volume or profitability.
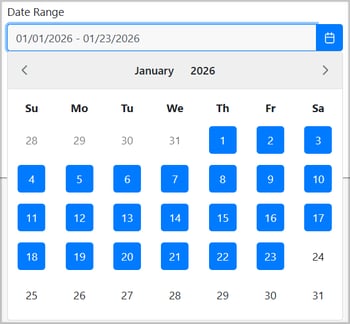
3) Set Date Type and Date Range
Date Type Options
-
Entry Date
-
Pickup Date (default)
-
Delivery Date
-
Invoice Date
Date Range: Use the inline calendar selector to choose a start and end date.
4) Apply Optional Filters
You can narrow the report results using:
-
Customer
-
Carrier
-
Shipment Type
5) Set Shipment Status Range
Control which shipment statuses are included:
-
Min Shipment Status (default: Committed)
-
Max Shipment Status (default: Complete)

This is useful if you want to exclude early-stage shipments (quotes, etc.) or focus on completed work.
6) Optional: Show Only Invoiced Shipments
Enable Show Only Invoiced Shipments to restrict results to shipments that have been invoiced.
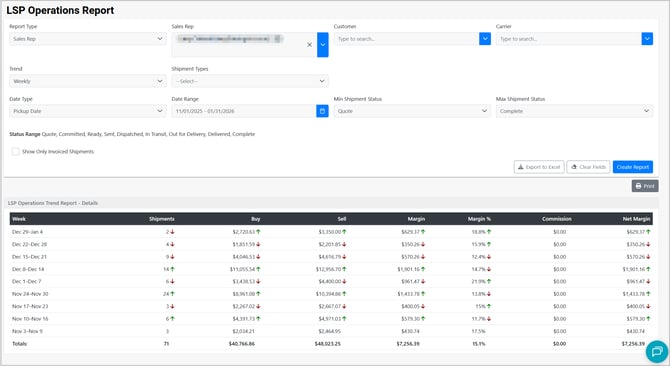
Report Output (What You’ll See)
The report returns a trend table grouped by your selected trend type. Each row represents a time period (day/week/month/year), and includes these KPIs:
| Column | Meaning |
|---|---|
| Shipments | Total shipment count for the time period |
| Buy | Total carrier cost |
| Sell | Total customer revenue |
| Margin | Sell - Buy |
| Margin % | Margin / Sell |
| Commission | Total commission (if applicable) |
| Net Margin | Margin - Commission |
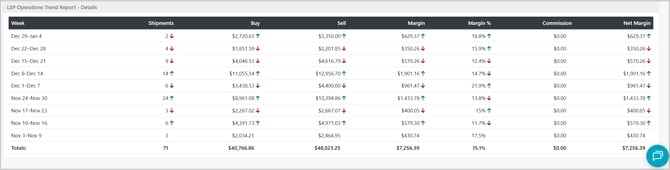
At the bottom of the report, totals are included for the full selected date range.
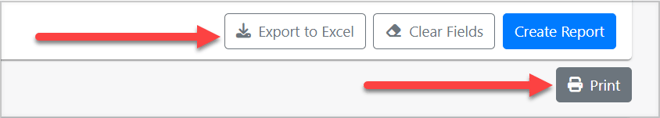
Exporting & Sharing
The Operator Performance Report supports:
-
Export to Excel
-
Print-friendly output