![TAI_LOGO_CMYK Option 1.2-03.jpg]](https://learn.tai-software.com/hs-fs/hubfs/TAI_LOGO_CMYK%20Option%201.2-03.jpg?height=40&name=TAI_LOGO_CMYK%20Option%201.2-03.jpg)
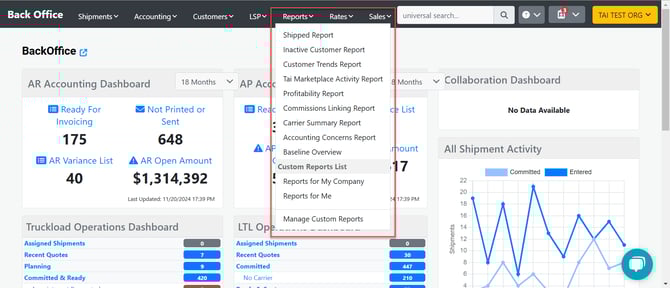
- Shipped Report
- Inactive Customer Report
- Customer Trend Report
- Tai Marketplace Activity Report
- Profitability Report
- Commissions Report
- Accounting Concerns Report
- Baseline Overview
- Manage Custom Reports
Report previews and exports
Reports open as a preview. When a report returns more than 1,000 rows, the results page shows the first 1,000 and an alert above and below the table reads:
Showing the first 1,000 of 6,752 rows. Use Export to download the full report.
The number shown is your report's real total. A report returning 1,000 rows or fewer displays in full with no alert.
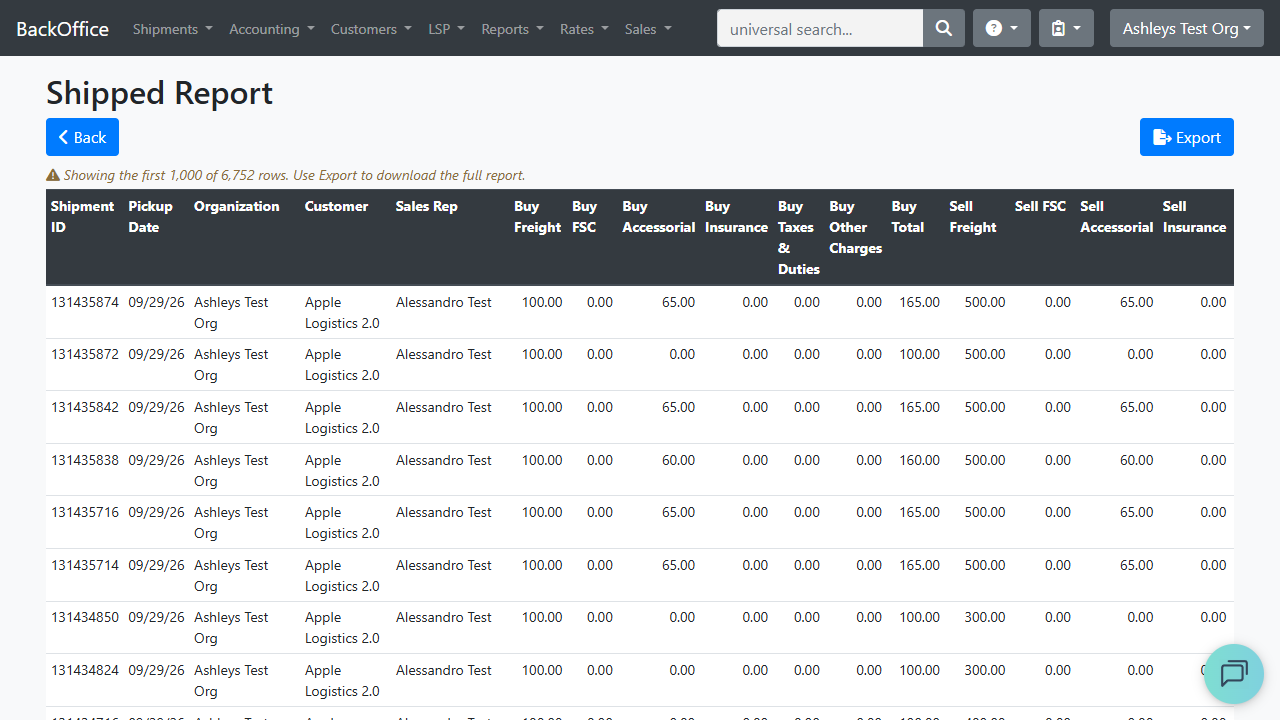
The preview carries the same columns, filters and sort order as the finished report, so it is the fastest way to confirm your parameters before pulling the whole data set.
To get the complete report, click Export on the results page. The download always contains every row the report returns, not just the 1,000 on screen. You can also click Export to Excel on the parameters page without viewing the results first; that download is likewise the complete report.
This applies to the Shipped, Inactive Customer, Customer Trend, Tai Marketplace Activity, Profitability, Accounting Concerns and Baseline Overview reports, and to Custom Reports. Custom Reports asks which version you want when you export — see the Custom Report Builder article for that step.
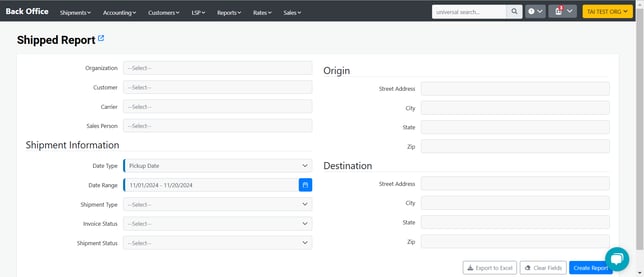
Shipped Report
This report allows customers to get general information about shipments. It can be generated for a customer or the whole organization.
Inactive Customer Report
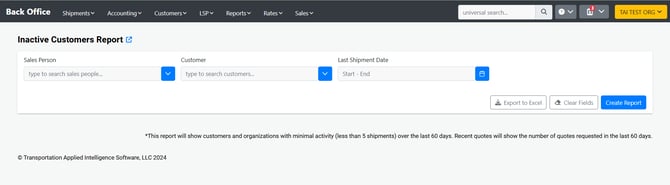
This report will show customers and organizations with minimal activity (less than 5 shipments) over the last 60 days.
Customer Trend Report
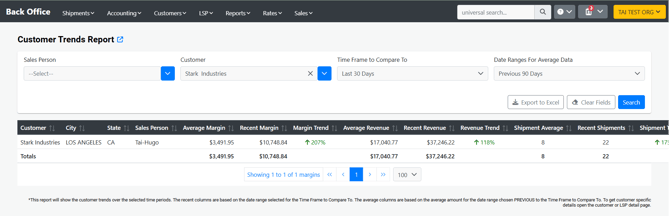
This report will show the customer trends over the selected time periods. The recent columns are based on the date range selected for the Time Frame to Compare To. The average columns are based on the average amount for the date range chosen PREVIOUS to the Time Frame to Compare To.
Tai Marketplace Activity Report
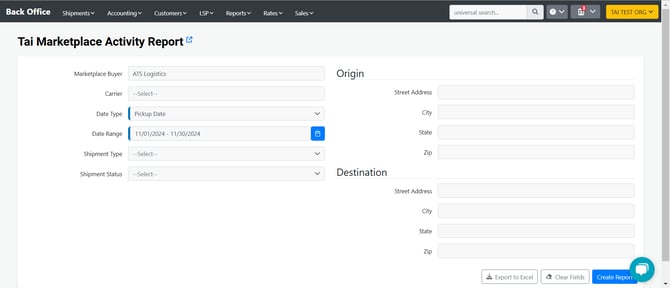
This report allows our customers to get detailed shipment information whenever they use Marketplace tariffs.
Profitability Report
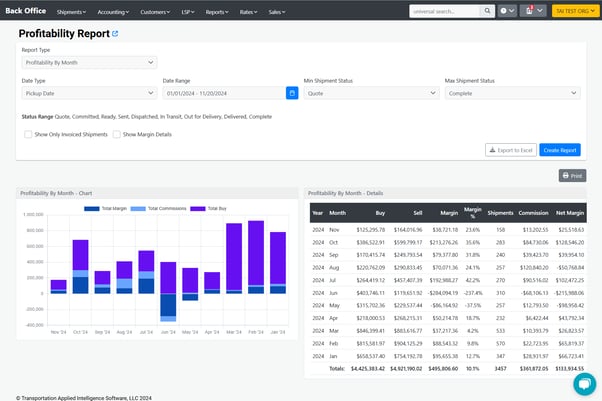
This report allows our customers to track and analyze financial performance.
Commissions Reports
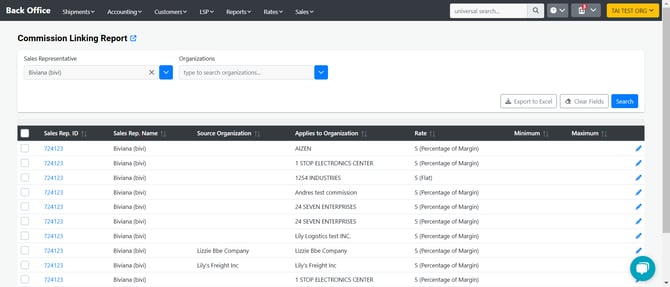
The commissions report allows our customers to easily access their commissions' information. They can get information by sales rep and organization.
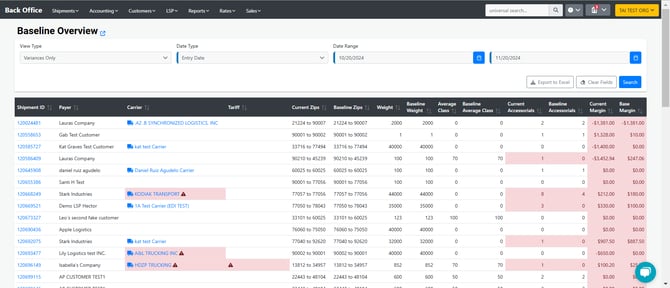
Baseline Overview
This report will show the values for margin and basic shipment information at the time of commitment.
Manage Custom Reports
The TMS custom report builder offers users flexibility in data analysis. By providing access to a wide array of data points, users can create customized reports tailored to their specific needs.
Click here to learn more about custom reports.
Accounting Concerns Report
To access, click Reports on the Top Menu, then Accounting Concerns Report.
For the video tutorial, click here
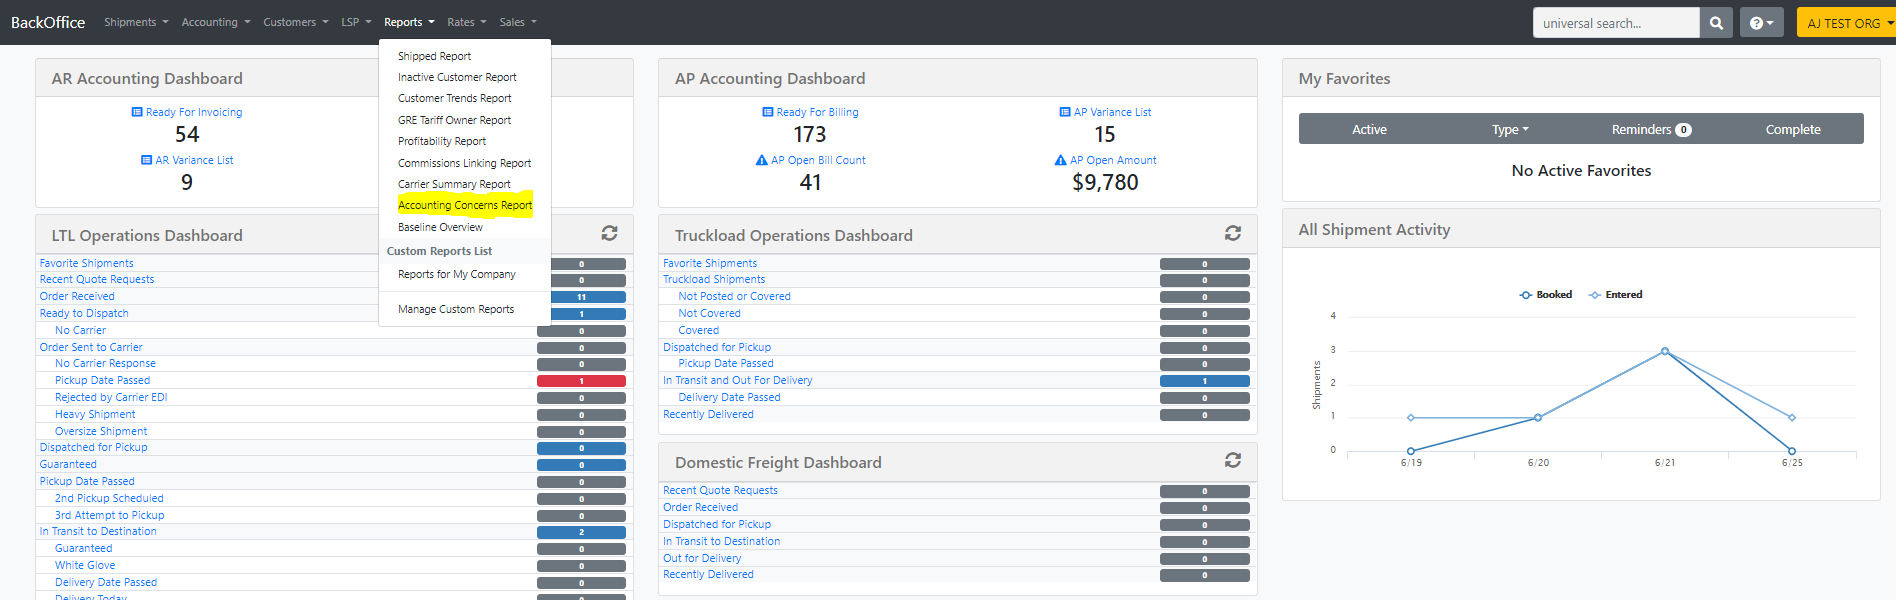
Included in Accounting Concerns are the following:
- Missing AR
- Missing AP
- Negative Margin
- Missing AR Rev: There was a Bill Revision done but no corresponding AR Revision
- Missing AP Rev: There was a Revision on the AR Side but not on the AP Side
If any of these Accounting Concerns are selected alongside the Data Range Period, Invoice results within these frames will be Searched and listed below
Other accounting-related reports
- AP Payment History
- AR Payment History
- Approved Bill Summary
- Collection Summary
- Unapproved Bill Summary
GL Reports
The TMS allows our customers to access financial information quickly through revenue and expense reports. To learn more about the GL Report, click here.
Customer Report
This feature allows your customers to create a report from the customer portal.
Click here to access the article.