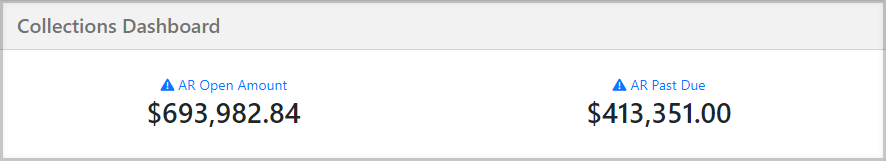
Collections Dashboard
AR Open Amount
The AR Open Amount represents the total value of open invoices and is associated with the shipments assigned to the sales representative.
AR Past Due
The AR Past Due represents the total value of invoices past their due date and is associated with the shipments assigned to the sales representative.
Note: Clicking on the AR Open and Past Due hyperlinks will take you to the collection summary. The system will automatically filter the information based on the sales representative, allowing you to review important details about the customer quickly. This includes their name, credit limit, total open amount, total invoiced amount, amount not yet invoiced, and current amount. However, please keep in mind that your ability to access this information will depend on your Accounting Permissions in the TMS.
Margin Dashboard
The Margin Dashboard lets sales reps compare their Revenue and Margin amounts from Last Month, This Month, and the Previous Seven Days.
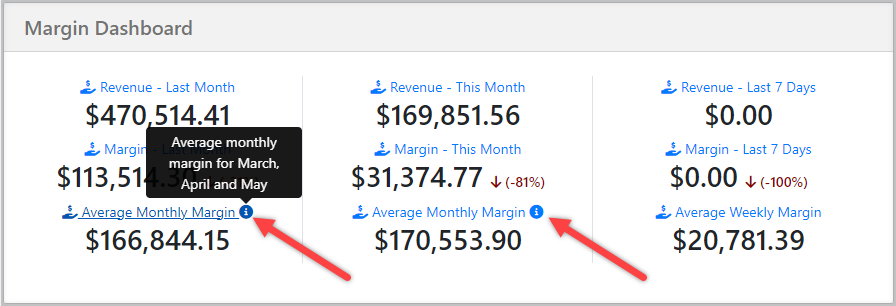
The Average Monthly Margin in the First column represents the average margin achieved over the past 90 days leading up to the start of the previous month.
The Average Monthly Margin in the Second column represents the average margin achieved over the past three months, excluding the current month up to today's date. The start date for this calculation is the beginning of the first month in the three-month period.
The Average Weekly Margin is calculated by considering the number of weeks in the previous 90 days, excluding the current week.
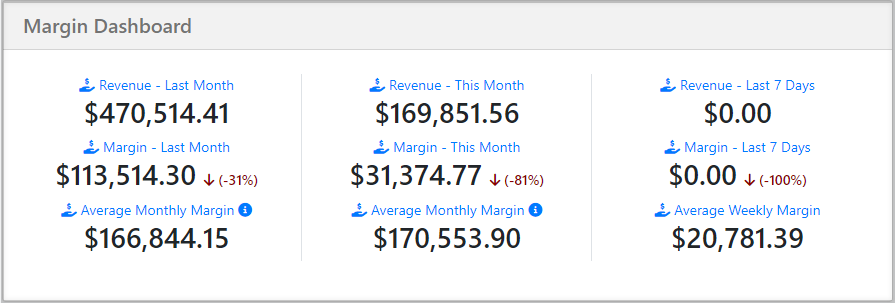
To find out which months the system is using to calculate the Average Monthly Margins, simply check the blue information icons.
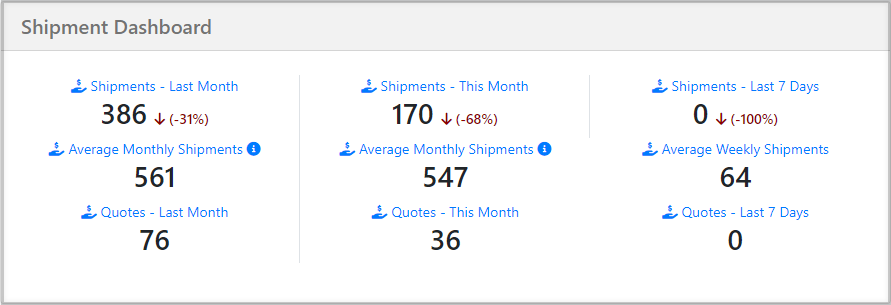
Shipment Dashboard
The Shipment Dashboard lets sales reps compare the number of shipments from Last Month, This Month, and the Last Seven Days.
The Average Monthly Shipments in the First column represents the average shipments achieved over the past 90 days leading up to the start of the previous month.
The Average Monthly Shipments in the Second column represents the average shipments achieved over the past three months, excluding the current month up to today's date. The start date for this calculation is the beginning of the first month in the three-month period.
The Average Weekly Shipments is calculated by considering the number of weeks in the previous 90 days, excluding the current week.
Sales Reps will also have the ability to compare Quotes from the Previous Month, the Current Month, and Quotes from the Last Seven Days.
Customer Dashboard
This graph will display the percentage of active and inactive customers. For our purposes, an inactive customer is defined as one who has not had a shipment within the past 30 days.